
Attractiveness Scale 1-10: What Each Number Means and Where You'd Land
On the 1-10 attractiveness scale 5 is average and 7 is good-looking, not a C. What a 6, 7 or 8 out of 10 means, why the photo moves it, and where you'd land.

A 7 out of 10 in looks means good-looking: a face strangers notice, though not one they'd call rare. It sounds like a C, because 7/10 on a test is 70%. But looks aren't graded like a test: most faces get rated 4 to 6, so a 7 already sits above the bulk of the crowd.
Here for a test score? 7/10 is 70%, a C on the College Board's standard conversion. The rest of this page is about the other kind of 7.
Called a 7 by a friend, a Reddit thread or an app? Below: is it good, why not an 8, and was it you or the photo? That last one matters most, because the answer is usually the photo. And if nobody has handed you a number yet, where you'd land is a one-photo question, answered further down.
Is a 7 out of 10 good for looks?
Yes. A 7 is good-looking by any everyday standard: above the middle, noticed by strangers, and common enough that you pass a few every week. It isn't "70% attractive"; the scale isn't a percentage.
So what does a 7 out of 10 look like? Usually not a model. It's an ordinary face with nothing that subtracts and one or two things that pull: clear skin, a haircut that suits the head, an easy expression, clothes that fit.
What separates a 7 from an 8 is consistency: an 8 still looks good in a harsh selfie under office lights. Plenty of 7s are one better photo away from being called an 8.
Why is the middle of the 1-10 scale so crowded?
Because 5 means average and most faces sit near average, ratings pile up at 4-6 and thin out fast on both sides. That shape is why a 7 is better than it sounds.
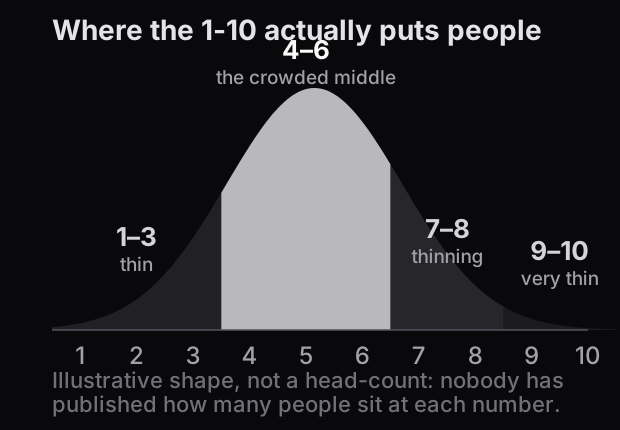
We call the misreading the report-card trap. On a report card, 7/10 is a C, a middling mark. On a looks scale the middle is 5, so a 7 means most people were rated lower.
Real rating data fits that shape. When OkCupid analysed its users' photo ratings in 2009, men's ratings of women formed a near-symmetric bell with most people at "medium" (OkCupid, 2009). Nobody has published a census by number, so treat any percentile an app quotes you as a guess.
What does each number on the 1-10 scale mean?
Each number is a shared convention, not a measurement: 5 is the centre of the crowd, 7 is good-looking, and 9-10 are mostly rhetorical.
| Number | What raters usually mean | Common misreading |
|---|---|---|
| 1–3 | Rarely sincere; usually an insult | A real verdict |
| 4 | Slightly below average, not unattractive | "Ugly" |
| 5 | Dead average | A failing grade |
| 6 | Slightly above average | A disappointment |
| 7 | Good-looking; strangers notice | "Only 70%" |
| 8 | Attractive in almost any photo | A different species from 7 |
| 9–10 | Rare; most online "10s" are retouched | A realistic target |
What is a 6 out of 10?
A 6 is slightly above average: nothing stops a stranger, and nothing subtracts. Socially it's hard to tell from a 7; it mostly loses in still photos, which strip out the expression and movement ordinary faces rely on.
What is an 8 out of 10?
An 8 is attractive across photos, lighting and moods: people mention your looks when they introduce you. An 8.5 is the same band, hedged upward.
Is a 5 out of 10 average or below average?
Average, exactly. Forums treat 5 as an insult because they deflate on purpose. On the everyday scale it's where most people live; see what average-looking really means for a guy.
What is a 4 out of 10?
A 4 is slightly below the middle, not unattractive: a face with one thing subtracting, and usually something fixable. The most common 4 is a bad photo of an ordinary face. Before you accept it, retake the picture in daylight, five feet back.
What is a 7.5 or an 8.5 out of 10?
A half point is the rater hedging between two bands, not extra precision. Read a 7.5 as a strong 7 and an 8.5 as a solid 8; neither changes which band you are in, and both usually move with the next photo.
What is a 1, 2 or 3 out of 10?
Honest 1s and 2s barely exist; they're insults, not ratings. A real 3 is uncommon. If a stranger's number can sink your week, that's appearance anxiety, and it deserves a talk with someone qualified more than another rating.
Where would you land on the 1-10 scale?
One photo answers it faster than any thread: our test reads your face, physique and outfit the way a stranger does in the first second, and shows the band you land in before you pay. A mainstream 7 corresponds roughly to "Above threshold", 115 to 129 on our 70-155 axis, where the median everyday man sits around 110. Full disclosure: we build that test, and use an axis instead of a 1-10 because real life runs less on rank than on whether a stranger's first read clears the bar.
| If you were handed… | Our band | On our axis |
|---|---|---|
| 3 or below | Below threshold | under 95 |
| 4 | Approaching threshold | 95–104 |
| 5–6 | At threshold | 105–114 |
| 7 | Above threshold | 115–129 |
| 8 | Strong appeal | 130–144 |
| 9–10 | Magnetic | 145+ |
That's two conventions side by side, not a conversion formula; nobody has published one. If the number arrived with "find your looksmatch", the looksmatch calculator applies the same read to that question. Find your band: about a minute of quick picks and two photos, and your band and appeal personality show up roughly 40 seconds after you submit, before you pay anything. The full report, your exact read and natural ceiling, face, physique and outfit read part by part, and how many of 100 women passing you would notice you, is a one-time $5; the account is created from your checkout email.
How do you rate someone 1 to 10, or rate yourself?
Raters treat 5 as the average person they see, take in the whole face in a fraction of a second, and round that impression to a digit. In Willis and Todorov's experiments, attractiveness judgements after a 100-millisecond look correlated highly with judgements made with no time limit. And in 11 meta-analyses, Langlois and colleagues found that people agree about who is attractive, within and across cultures. Bands are stable; decimals are noise.
Rating yourself is harder. Swap "what am I?" for "what has happened?" and count how many were true in the past year:
- Strangers start conversations that aren't about the transaction.
- Unposed photos others take of you look fine to you.
- Dating-app matches come in on photos alone, including from people you'd call better-looking.
- Friends introduce you by mentioning your looks.
- People remember meeting you when you don't remember them.
Two or three is the common answer: the crowded middle, seen from inside. Four or five puts you above it. Zero or one can just mean low exposure; a man who skips the apps can count zero at a 7. More in signs you're more attractive than you think.
Prefer a read to a count? Our first-impression test looks at your actual photos and shows whether face, physique or outfit is pulling the read up or down. For men, about a minute of questions plus two photos; the analysis comes first, then $5 opens the full report, once.
Can a 6 become a 7?
Often, yes: the gap between a 6-rated and a 7-rated photo of the same man is mostly light, lens distance, grooming, expression and fit, not bone.
In a 2011 Glasgow study, different photos of the same person varied more in rated attractiveness than different people did. Lens distance alone reshapes a face: a selfie from 12 inches makes a man's nose look about 30% larger, while a portrait from 5 feet shows essentially no distortion (JAMA Facial Plastic Surgery, 2018).
The levers, in the order they usually matter:
- The photo. Eye-level camera, about 5 feet back, window light (front camera vs back camera).
- Grooming. Haircut, facial hair, skin: the fastest visible change.
- Fit and posture. Clothes cut for your frame, chin level.
- Body composition. Slow, and often the biggest change when it moves.
- Bone structure. What forums argue about most; what you can change least.
Mirror and photos disagree? Mirror vs photos explains which one strangers see, and the test names the lever holding your read back.
Why does the same face get a 5 from one rater and an 8 from another?
Because raters agree on direction, not decimals, and often they aren't judging the same face. One saw a harsh phone shot; the other saw you in daylight, smiling. Two more things widen the spread:
- Reference frame. In Kenrick and Gutierres's 1980 experiments, people who had just watched glamorous TV stars rated an average-looking stranger lower, a contrast effect.
- Venue. Rating threads reward harshness and friends reward kindness; how r/RateMe scores work shows the first up close.
Is the 1-10 attractiveness scale different for men?
Same scale, colder raters. In OkCupid's 2009 data, women rated 80% of men as "worse-looking than medium," while men's ratings of women formed a symmetric bell. A 7 from a woman is a stronger compliment than it sounds.

Men's forums run cold on purpose: a mainstream 7 becomes a forum 5, and the crowded middle gets relabelled as failure. Translate a forum or app number back before you feel anything about it. The PSL scale maps the forum dialect; Umax score vs real life covers app numbers.
The bottom line
A 7 out of 10 is good-looking, not a C. Round any number you're handed to a band, then ask the better question: what does a stranger read in the first second, and which part of it can you move? Your face doesn't have a number that decides your life. It has an effect on people, and more of that effect is adjustable than any rating admits.
Studies referenced
- Jenkins, R., et al. (2011). Variability in photos of the same face. Cognition, 121(3), 313-323. https://doi.org/10.1016/j.cognition.2011.08.001
- Kenrick, D. T., & Gutierres, S. E. (1980). Contrast effects and judgments of physical attractiveness: When beauty becomes a social problem. Journal of Personality and Social Psychology, 38(1), 131-140. https://doi.org/10.1037/0022-3514.38.1.131
- Langlois, J. H., et al. (2000). Maxims or myths of beauty? A meta-analytic and theoretical review. Psychological Bulletin, 126(3), 390-423. https://doi.org/10.1037/0033-2909.126.3.390
- Rudder, C. (2009, November 17). Your looks and your inbox. OkTrends, OkCupid's company blog (platform data, not peer-reviewed).
- Ward, B., et al. (2018). Nasal distortion in short-distance photographs: The selfie effect. JAMA Facial Plastic Surgery, 20(4), 333-335. https://doi.org/10.1001/jamafacial.2018.0009
- Willis, J., & Todorov, A. (2006). First impressions: Making up your mind after a 100-ms exposure to a face. Psychological Science, 17(7), 592-598. https://doi.org/10.1111/j.1467-9280.2006.01750.x
Frequently asked questions
What is a 7.5 out of 10 in looks?
A 7.5 is a rater hedging between 7 and 8, so read it as a strong 7: good-looking, and often one better photo away from reading as an 8. Start with which photo to use.
Is 8.5 out of 10 good for looks?
Yes. An 8.5 is clearly attractive and looks good in almost any photo or setting. The half point is a rater hedging, not extra precision, so read it as a solid 8 and see what conventionally attractive means.
What is a 6.5 out of 10?
A 6.5 sits on the line between the crowded middle and good-looking: above average, and the rating most likely to move with a better photo. The quickest fix is in front camera vs back camera.
Where does the 1-10 attractiveness scale come from?
Pop culture, not science. The 1979 film 10 made 'a perfect 10' everyday English, and Hot or Not, founded in October 2000, had users rate strangers' photos 1 to 10 and averaged the votes. Researchers use their own rating scales; see how much science there is on facial attractiveness.
How is the PSL scale different from the 1-10 scale?
PSL is a forum recalibration that deliberately deflates scores, so a mainstream 7 is often called a PSL 5. It is a subculture convention, not a research instrument; the PSL scale guide explains why its numbers run cold.
Can an AI rate my looks on a 1-10 scale?
It can print a number, but it is measuring one photo, not you, and no algorithm has the ground truth of attractiveness. Our first-impression test estimates the read a stranger forms from your photos instead, for men, on a 70-155 axis rather than a 1-10. Treat any tool's number, ours included, as one input.